Your Blood Test Results: A Basic Guide

You’ve gotten your blood test results back, but you have no idea what they mean. In addition, some results will be affected by nutritional ketosis. Here’s a short overview from a ketogenic perspective on how to translate the numbers, and what they mean. The information in the table below will help you sort out the numbers and figure out what you need to address in terms of your health.
Note on Blood Test Results for Cholesterol
Cholesterol is actually a waxy alcohol, not a fat. You know that wax doesn’t mix with water, so in order to move cholesterol through the watery medium of blood, the body has to package cholesterol in a "carrier" protein shell called a lipoprotein. You’ve probably heard of these lipoproteins; some are named HDL, others LDL, and also VLDL. All of these names mean the same thing really; they are all just parts of cholesterol in different packages.
The Numbers...
https://www.ncbi.nlm.nih.gov/pubmed/9355888Test | Ref Range | Explanation |
Total Cholesterol | 100-199 mg/dL | This is the total number of cholesterol particles in your blood. It doesn’t mean much unless it is extremely high or extremely low. Total cholesterol levels have never been scientifically correlated with heart disease. Uneducated physicians and dietitians will tell you that this blood test result must be below 199 mg/dL for good heart health but this is not true. See Dr. Uffe Ravnskov’s book "Fat and Cholesterol are Good For You! or Dr. Malcolm McKendrick's book "The Great Cholesterol Con." Also, read this paper. |
HDL-C | >39 mg/dL | This is your total HDL (High Density Lipoprotein) level. HDL is called the “good” cholesterol because it picks up the cholesterol in your cells and takes them back to the liver. Higher HDL levels (above 39 mg/dL) indicate a healthier heart. HDL levels above 60 mg/dL are optimal. Eating more saturated fat and protein and cutting carbohydrates raises HDL. Raising HDL artificially with drugs does not have the same benefit as raising it via a change in diet. |
HDL - Large | <0.7 mg/dL | This is the percentage of total HDL which is large. The more large HDL particles, the healthier your heart. |
LDL-C | 0-99 mg/dL | This is your total LDL (Low Density Lipoprotein) level. LDL is called the “bad” cholesterol because it carries cholesterol to the cells, and at times, dumps the cholesterol inside the arteries. However, this dump inside the arteries only happens when the LDL is damaged by the presence of high blood sugar or oxidation. A diet which is high in carbs and processed foods will provide both high blood sugar and oxidation. There are several subfractions of LDL, and recently Krauss et al has identified “small LDL” as the dangerous type. The large fluffy type of LDL is protective. The problem with LDL measurements is that they are not a direct measure, they are a calculated measure. The calculation used is called the Friedewald Equation, and it is not very accurate. The equation looks like this: LDL-C = Total Cholesterol-(HDL-C)-(triglycerides/5). In cases where triglycerides levels are very low, the equation is not a good estimate of LDL-C and the blood test result is inaccurate. Most people who eat a low carb diet have very low triglycerides. |
Small LDL-P |
| This is the number of your total LDL particles which are small and dense. The theory is that the larger this percentage and the more small LDL which make up your total LDL, the higher your risk for heart disease. Small LDL is very easily damaged by oxidation. Eating a diet that is high in carbohydrate increases small LDL. This paper and this paper are good discussions on this topic. |
Large LDL-P |
| This is the number of your total LDL particles which are large and fluffy. This type of LDL is actually protective. This type is strongly correlated with lower triglycerides. |
VLDL | 5-40 mg/dL | This is an estimate of your Very Low Density Lipoprotein. VLDL cannot be measured directly, so it is usually estimated as a percentage of your triglyceride value. Lowering your triglyceride levels will also lower your VLDL cholesterol levels. |
Lipoprotein(A) |
| This a subfraction of LDL. Elevated levels of LP(a) are associated with a higher risk of atherosclerosis and heart disease. A low carb diet will lower LP(a). See this paper. |
Triglycerides | 0-149 mg/dL | Triglycerides are a type of fat in the body that can be stored or burned for fuel. High levels of triglycerides mean the body is not using these fats for fuel, and as they increase, so does your risk of a heart attack. For optimal health, triglycerides should be as low as possible, and at least under 100 mg/dL. Following a ketogenic diet plan will drop triglyceride levels quickly for most people. The ratio of triglycerides to HDL (expressed Triglyceride/HDL) is the best predictor of heart attack risk and is one of blood test results to which you should really pay attention. The closer this ratio is to 1:1, the healthier you are. See this paper. |
Fasting Serum Glucose | <100 mg/dL | This is your blood sugar level after fasting for 8-10 hours. Numbers above 126 mg/dL indicate blood sugar control issues, and a diagnosis of diabetes. High blood sugar levels are the main culprit in a host of disease states, and especially in heart disease and heart attack rates. |
Hemoglobin A1c (HbA1c) | <6.0% | HbA1c is a measurement of the glycated proteins in the blood. Proteins are glycated when elevated blood sugar sticks to them. Sticky proteins can cause blood to clot more easily. This test gives a picture of your blood sugar levels over the past several months. The EPIC study demonstrated that the higher the HbA1c levels, the higher the risk of heart attack. See this post and the study results here. NOTE: This study and this study showed that if one's iron levels are low, the HBA1c reading may be a higher but faulty number. |
C-Reactive Protein (CRP) | 0-3.0 mg/dL | C-Reactive Protein is a marker protein which indicates the amount of inflammation within the body. Higher levels of C-Reactive Protein on your blood test results means more inflammation within your body. Chronic inflammation has been recognized as the underlying marker for many disease states including atherosclerosis, diabetes and other autoimmune diseases. |
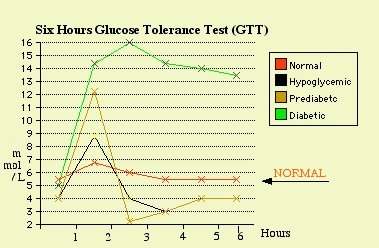
Glucose Tolerance Test (GTT) | <140 mg/dL at two hours | A glucose tolerance test measures how quickly your body can metabolized a specific amount of glucose, clear it from the blood and return blood sugar levels to normal. The test is used to test for diabetes, insulin resistance, and sometimes reactive hypoglycemia. Blood sugar is measured at the start, and then after 2 hours. The 2 hour measurement should be under 140 mg/dL. |
Interpreting blood test results correctly requires an understanding of how the tests were devised at times. Knowing more about how to read the numbers can help you take control of your health care and avoid unnecessary and often dangerous drugs. Most of these tests can be normalized by switching to a diet that is low in carbohydrates and processed foods, and high in natural fats and clean protein sources.
More Information
All of my books are available in electronic PDF, and now in paperback on Amazon!
 |
 |
 |
|
Buy paperbook on Buy paperback on Amazon Buy the e-Book via Paypal |
Buy paperback on Buy paperback on Amazon Buy the e-Book via Paypal |
Buy paperback on Buy paperback on Amazon Buy the e-Book via PayPal |